
Continuous automatic analysers

A map of the locations of six of these monitors, along with levels with latest pollution levels, is available on the 'latest pollutant levels' page of this website. Historical information, including trend graphs for monitoring carried out between 2006 to 2015 can be found on the 'historical data' page of this website.
For monitoring NO2, chemiluminescence analysers are employed at five locations within the city.
Dundee utilises five methods for monitoring Particulate Matter within the city including Partisol, tapered element oscillating microbalance (TEOM), Osiris, Beta-Attenuation Monitors (BAM), and FIDAS analysers for PM10, while PM2.5 is monitored using FIDAS analysers.
SO2 was monitored using UV fluorescence at the single monitoring site on Broughty Ferry Road until the end of 2014.
All continuous automatic analysers and the data that is obtained from them go through Quality Assurance and Quality Control processes to ensure that the data is accurate and precise.
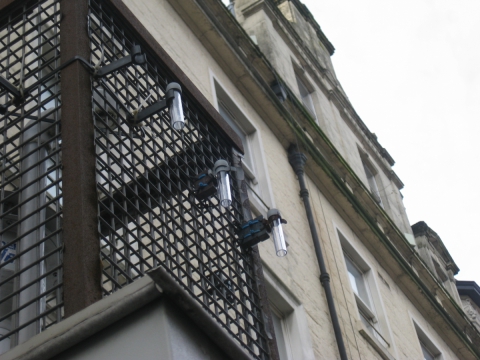
Diffusion tubes
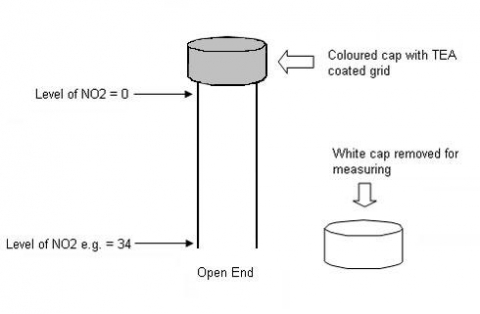
A diffusion tube is made of plastic and is 7.5cm long, and 1cm in diameter. Each end is sealed with a cap; one is coloured and the other is white. When we are ready to monitor we take off the white cap and place the tube in position. This is often on a pole near the side of busy roads and attached using a plastic holder and tie wrap. Inside the coloured cap there is a metal grid that has been soaked with a special fluid called ‘triethanolamine’ or TEA. Once the tube is in position air is ‘drawn up’ into the tube by the process of molecular diffusion.
When we have finished measuring, usually after one month, we put the white cap back on so no more NO2 will get in. The period of time the tube is open is called the ‘exposure period’. The tube is then taken to the laboratory where the NO2 is removed and measured. The result is the average NO2 in the air at that location for the exposure period (one month).
Historical data, including trend graphs, for each NO2 diffusion tube location for the 2006 to 2015 period can be found on the 'historical data' page of this website. Diffusion tube monitoring data for the 2012 to 2017 period can also be found on the Scottish Air Quality website.
More detailed information on all monitoring locations and data collected at each can be found in the Dundee City Council Air Quality Annual Progress Report 2018 (8.2MB PDF).
Contact
Email: pollution.control@dundeecity.gov.uk
Tel: 01382 433710